 AppDesk
App Store Analytics, Reimagined
A native iOS and macOS client for App Store Connect and Apple Ads. Sales, subscriptions, reviews, daily chart rankings and campaign spend — pulled straight to your device, read by on-device AI, and answered on every tab. Fast, private, and yours.

Everything you need to
manage your apps
Whether you're an indie developer or part of a larger team, AppDesk turns raw App Store and Apple Ads data into answers — what sold, where you chart, what your ads cost, and what changed in the last 30 days.
Focus on the metrics that matter
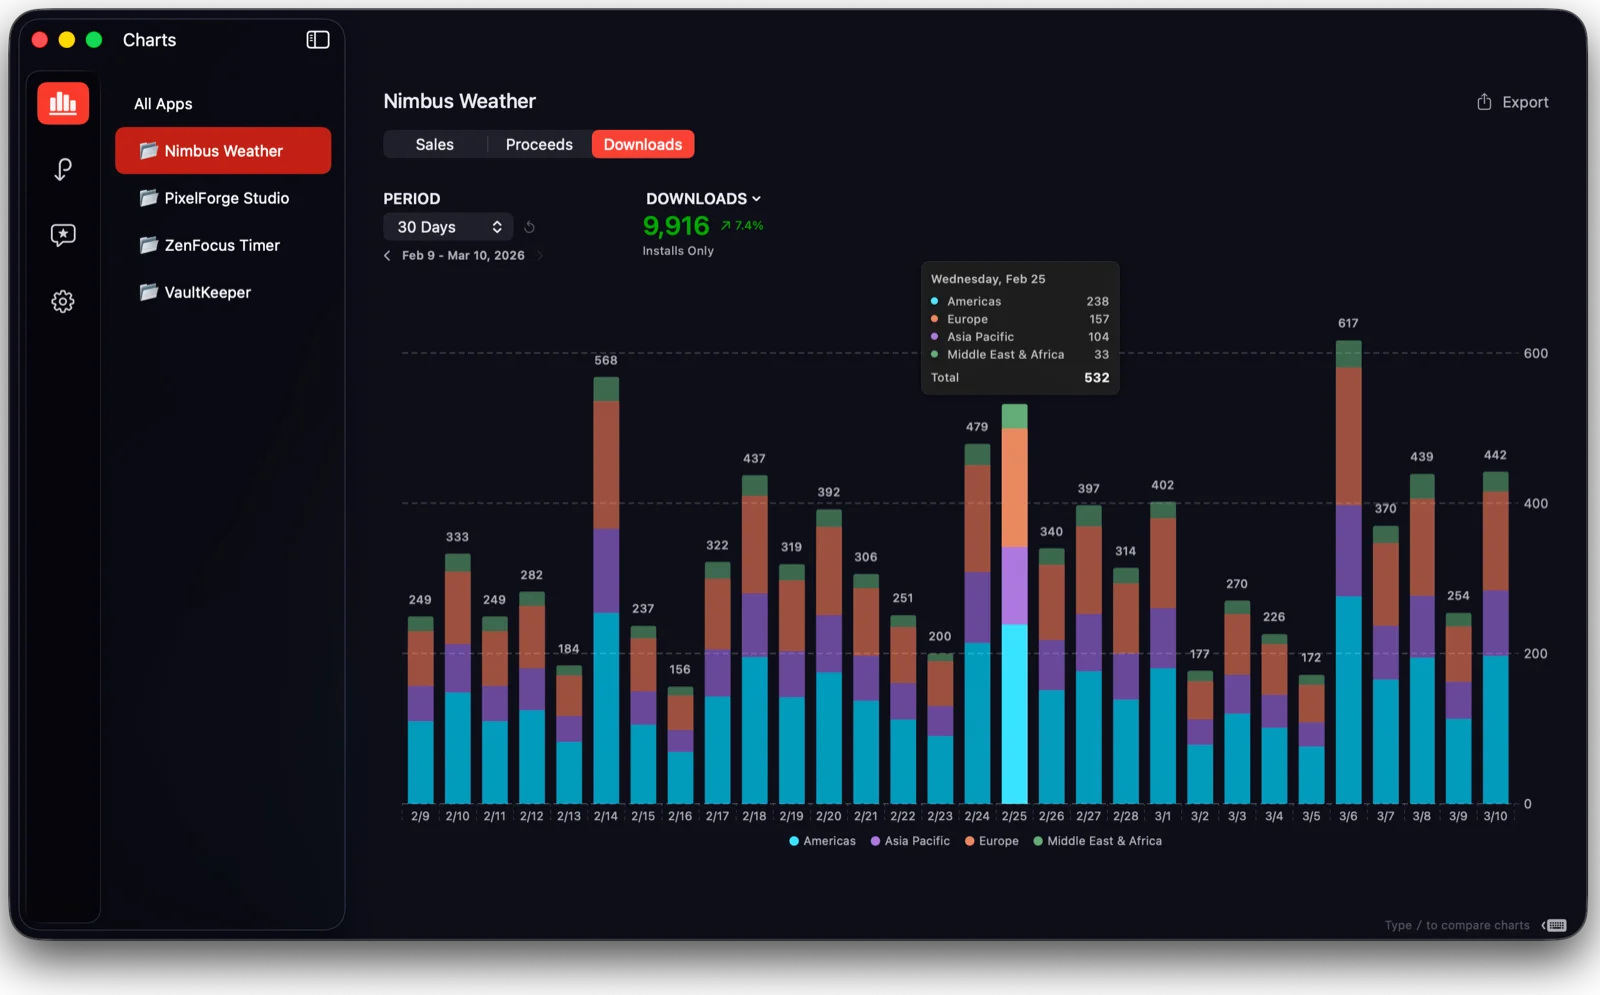
Beautiful stacked charts break down proceeds, sales, and downloads across all your apps or by individual SKU. Overlay previous periods or year-over-year data to spot trends instantly. Filter by geographic region, toggle between first-time and repeat downloads, and compare revenue against download volume — all with automatic multi-currency conversion. Draw your Apple Ads spend over the same timeline and a jump in downloads sits directly above what it cost.
Recurring revenue, decoded
Active subscribers, MRR, trial conversion rates, and churn risk — broken down by product, country, device, and billing period. Catch billing retries and grace period issues before they turn into lost subscribers.
See where your apps chart
Daily chart positions in every App Store storefront and category — free, paid and grossing, iPhone and iPad. Open an app for its full trajectory, sort positions by rank or by region, and see the countries it has quietly stopped charting in. Browse the Top 100 anywhere in the world and star competitors to watch.
What you spent, against what came back
Connect your Apple Ads account and daily campaign spend lands beside the revenue it was chasing. ROAS on developer proceeds, cost per install, cost per tap, and spend as a share of gross sales. Charts show each app's spend as a multiple of its own revenue and where the money actually went — what bought installs, what bought none, and what Apple never attributed to a keyword at all. A keyword table prices every search term against what a download of that app is worth, and says plainly where that estimate ends.
Insights, on every tab
An Insights button on Charts, Subscriptions, Reviews and Rankings reads your last 30 days and tells you what actually changed — which markets moved, how it compares with a year ago, which of your apps is pulling ahead, and what to do about it. Written by Apple Intelligence on device, so your figures and review text never leave the machine and analysis works offline. Where Apple Intelligence isn't available, AppDesk falls back to built-in rules.
Respond in seconds, not hours
On-device AI generates thoughtful, contextual responses that match your brand voice — your review data never leaves your device. Auto-categorize incoming reviews, flag what matters, filter by rating or status, and send responses directly to App Store Connect.
Built for speed and depth
Navigate your entire app business from the keyboard. Chart states are cached so switching between apps, time ranges, and tabs feels instant. Incremental sync pulls only what's new; historical sync backfills everything available. Export any view to CSV when you need deeper analysis.
Yesterday, at a glance
Home Screen and desktop widgets for proceeds, downloads and purchases, active subscribers, and subscription activations, renewals and cancellations — over a 7- or 30-day window, for the app you pick.
Every dollar of spend, priced against revenue
Apple Ads reports what you spent. App Store Connect reports what you earned. AppDesk holds both on the same device and does the division — for the period you are looking at, in the currency you picked. Apple Ads reporting and App Rankings are AppDesk Pro features.
Developer proceeds per dollar of Apple Ads spend, over the selected period.
Spend divided by the installs Apple attributes to those campaigns — not by total downloads.
What each tap on your ad cost, alongside the tap and install counts behind it.
Ad spend as a share of gross customer sales — sales before Apple's commission, not what you keep.
Each app's ad spend as a multiple of its own revenue, so the apps that spend more than they earn stand out on their own.
What each keyword cost and returned, what a download of that app is worth, and the spend that produced nothing at all.
And what it can't know. Apple reports installs per keyword and revenue per app — there is no key joining a search term to a purchase. AppDesk says so on the screen: per-keyword figures are compared against what an average download of that app is worth, and are labelled as the estimates they are. The app-level totals are measured, not modelled.
Your business data never leaves your device
No third-party servers that store your data. AppDesk connects directly to App Store Connect and Apple Ads, and keeps everything locally on your iPhone, iPad, or Mac. Just fast, private analytics you own completely.
No intermediary servers
Sales, subscriptions, reviews and ad spend go straight from Apple's APIs to your device
Keychain storage
App Store Connect and Apple Ads credentials are stored securely within the system Keychain
On-device AI
Insights and review replies are written by Apple Intelligence locally — and work offline
Rankings, in the open
Chart positions are public data we look up for you. AppDesk sends an App Store app ID and nothing else — no credentials, no sales figures
Up and running in minutes
Connect your App Store Connect account and start exploring your data right away. Add Apple Ads whenever you want spend beside it.
Generate an API Key
Create an App Store Connect API key in the Users and Access section. You'll get an Issuer ID, Key ID and a private key file.
Enter Your Credentials
Open AppDesk and paste your Issuer ID, Key ID, Vendor ID and select your .p8 private key file. Credentials are stored securely in your Keychain.
Sync & Explore
AppDesk syncs your sales, revenue, reviews and chart rankings directly from Apple. Browse charts, manage reviews and open Insights on any tab.
Add Apple Ads
Optional, and a Pro feature. Create an Apple Ads API client and campaign spend, ROAS and keyword costs appear beside the revenue they were chasing.
Ready to take control of
your App Store data?
Try the Demo mode to explore AppDesk before connecting your account.